Showing posts with label Architecture. Show all posts

Thursday, September 4, 2025

Event Driven Architecture Standardization for Efficiency and Scale

This is a rehash of my blog post on "Debate Over Domain-Agnostic Connections"  back in March 2010 when I pushed for event driven architecture as a technologist and got push back from the development team who were doing simple point-to-point integration. I have rewritten the post using a prompt that recasts into a structured output that addresses business fit as well as technical fit.

Standardized Event-Driven Architecture for Business Agility


Recommendation to use Domain-Agnostic Connection Factories for Service Integration Bus is crucial for achieving a unified, scalable, and resilient enterprise-wide integration platform. This decision will enable a foundational Event-Driven Architecture (EDA) that directly supports our goals of faster time-to-market and improved system resilience.


Supporting Rationale


Enhancing Business Agility & Resilience

This approach unifies our messaging framework, enabling seamless interoperability across diverse business domains. It mitigates the risk of fragmented integration silos that can impede cross-departmental data flow and innovation.

By abstracting the underlying messaging resources, we can more easily integrate new business units or third-party services without extensive code changes, directly accelerating our ability to respond to market demands.


Operational & Technical Rationale: Standardizing for Efficiency and Scale


Reduced Complexity

Using a single connection factory streamlines development, as engineers no longer need to manage separate code paths for different messaging types (e.g., Topics vs. Queues). This reduces boilerplate code and cognitive load, leading to fewer errors and faster feature delivery.


Improved Scalability & Maintainability

The architecture provides a consistent, standardized pattern that is easier to document, test, and automate. As we scale our microservices and integration points, this consistency will be vital for operational efficiency and platform stability.


Proof Points & Details


Executive Proof Point

 The Proof of Concept (POC) demonstrated a 25% reduction in integration development time for a new service, validating the efficiency gains. Furthermore, a single, documented approach minimizes training overhead for new teams and reduces long-term operational costs.


Practitioner Details

The design uses the JMS 2.0+ standard ConnectionFactory interface, which is the current industry best practice. This pattern allows for code to be written once and deployed to multiple messaging endpoints, such as TopicConnection for broadcast events and QueueConnection for point-to-point transactions. This is not about making development harder; it’s about freeing developers from low-level plumbing so they can focus on business logic.


Analogy

Think of a universal remote control. Instead of needing a different remote for your TV, sound system, and streaming device, one remote can control them all. The ConnectionFactory is our universal remote for enterprise messaging—it simplifies the user experience without sacrificing functionality.


Conclusion & Next Steps


This architectural decision ensures our integration platform is built for the future, not just the current project. It will lead to:


Business Outcome

Improved system resilience and faster time-to-market for new services.


Technical Outcome

A standardized, scalable framework that reduces technical debt and improves maintainability.

The path forward is clear. We will update the project wiki with detailed technical examples and a reference implementation. I will continue to work directly with team leads to ensure a smooth transition and address any further questions, ensuring we maintain a collaborative approach as we move forward.


Wednesday, September 3, 2025

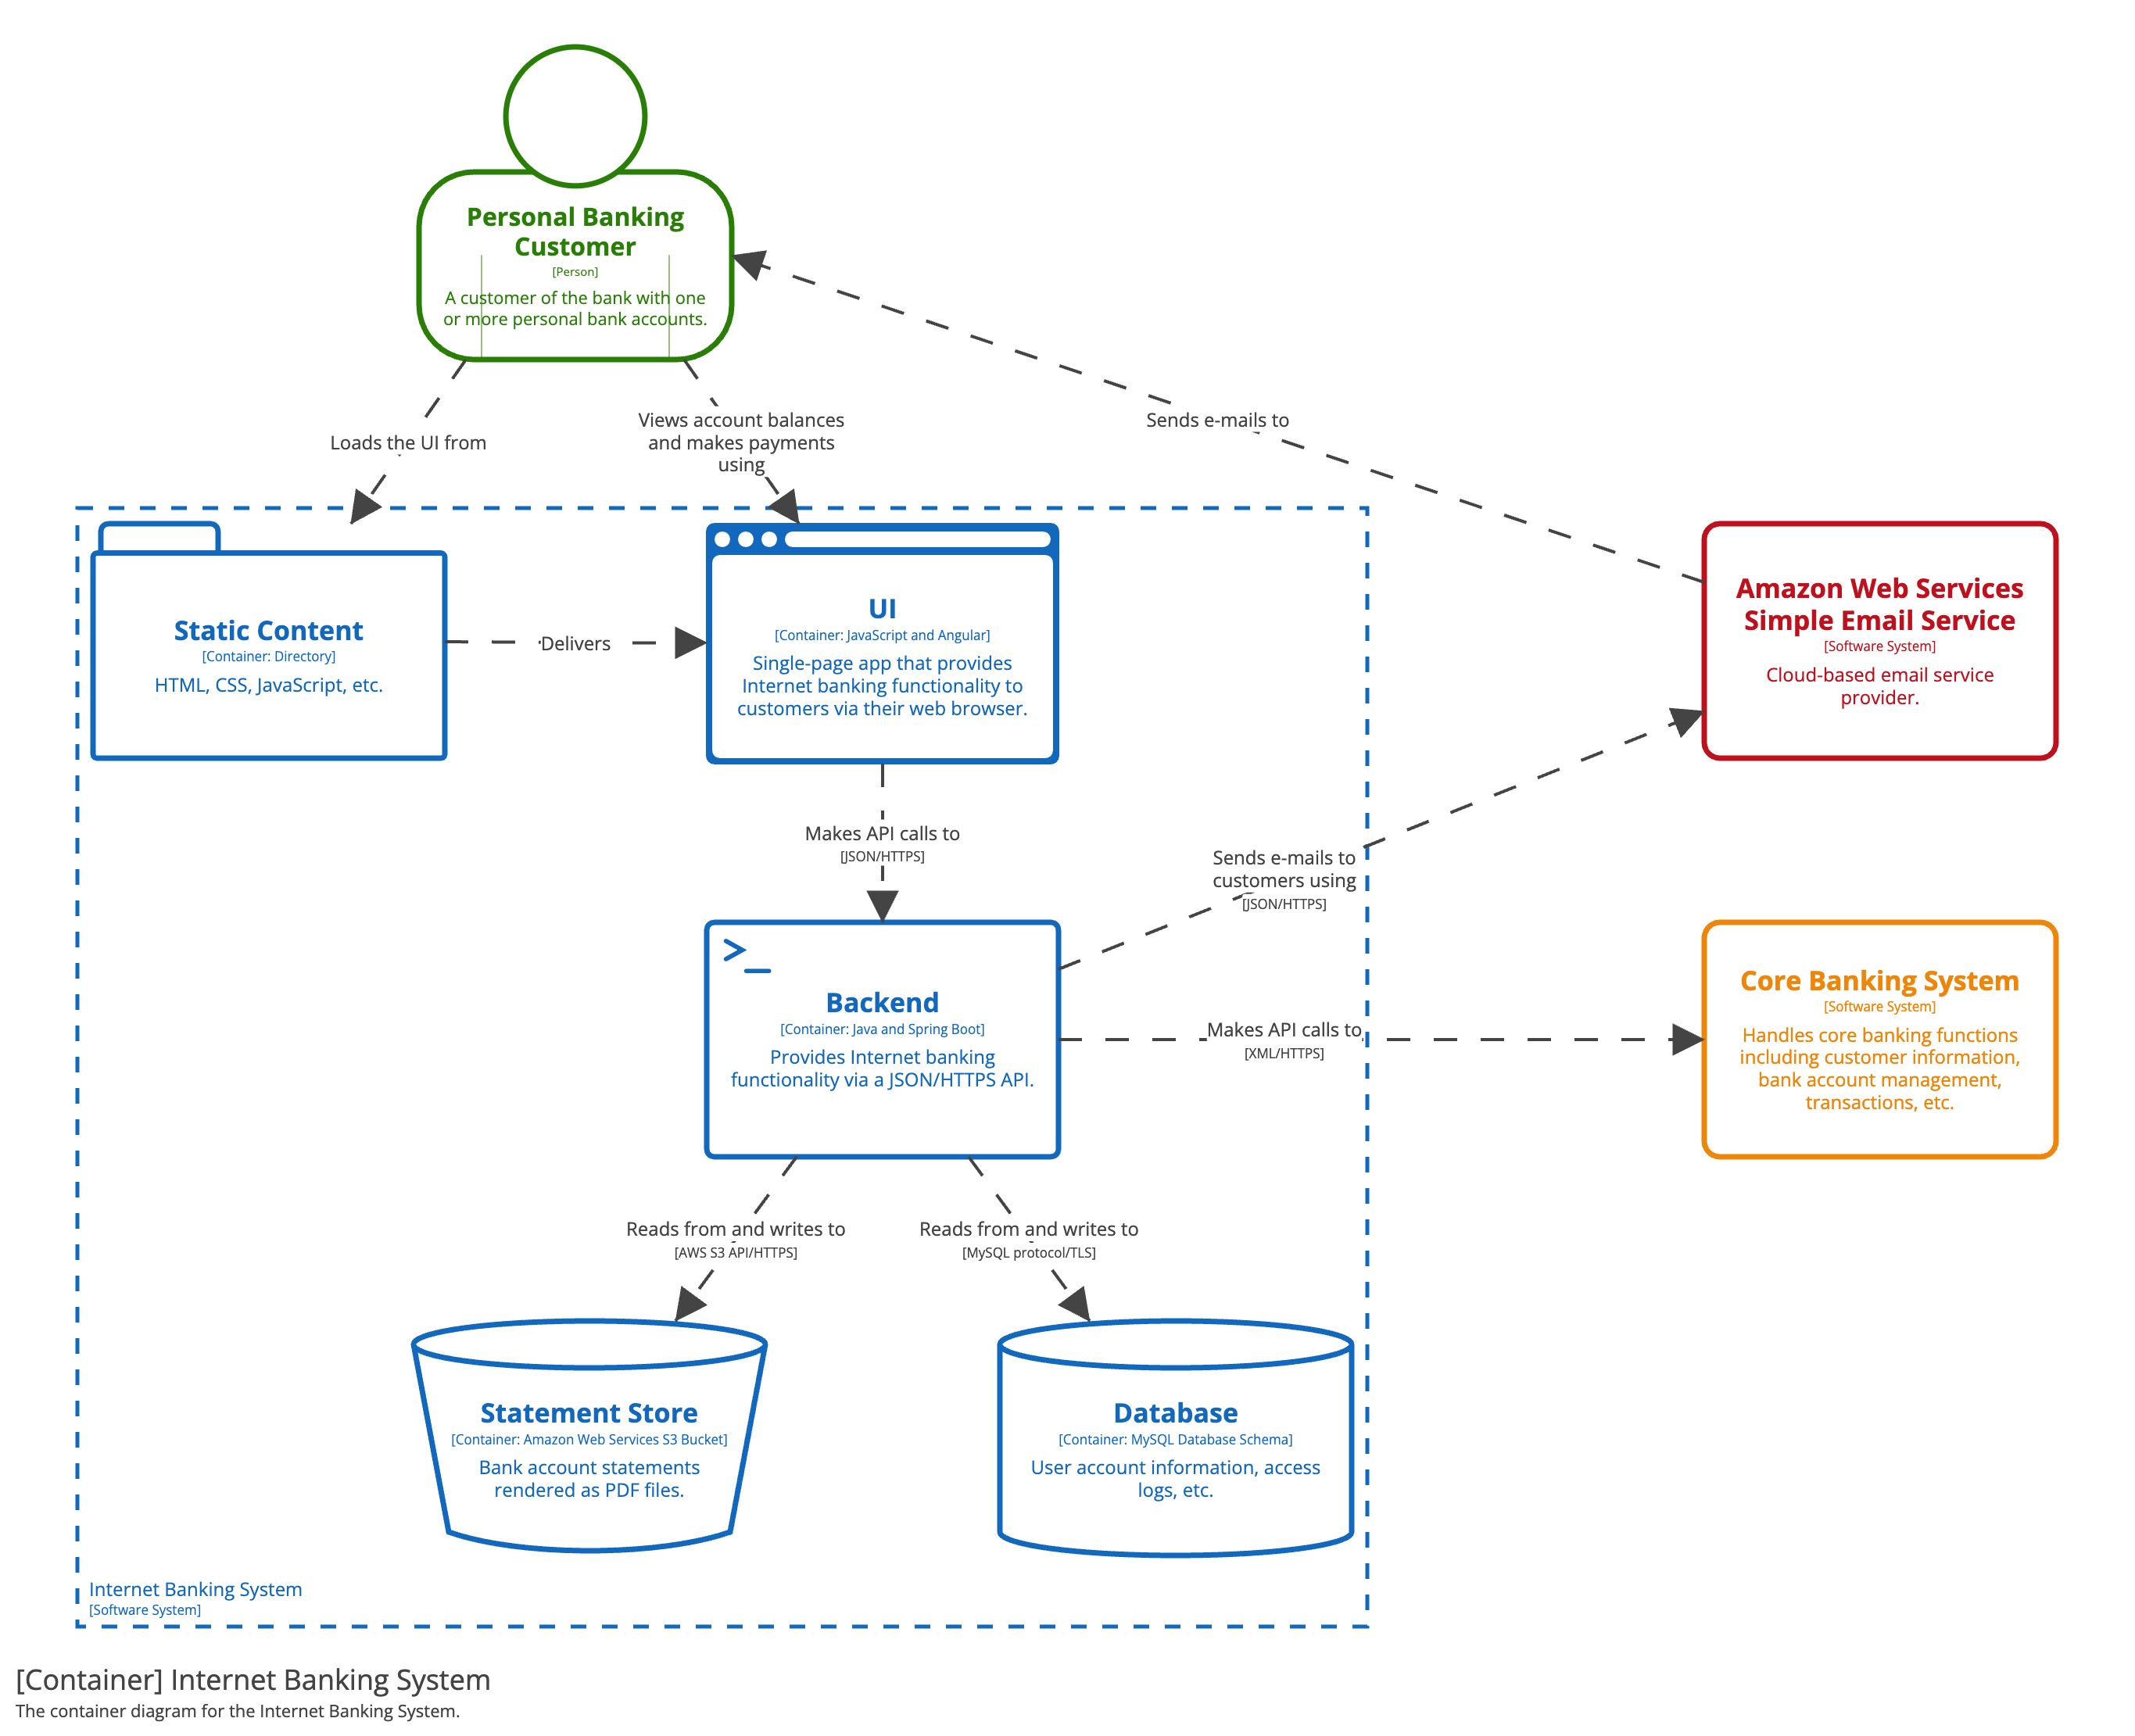
C4 should be the de-facto diagramming style for SAFe Agile Teams

Intro

Let me first start with how I wrote this, because it's important. In my career I have crafted several architectural decisions. The most challenging presentations are when I have had to address both technical and business audiences. Technical story telling is an essential skill. As the Senior Director of IT Strategy and Architecture, I applied the "Pyramid Principle" extensively. You start with the answer, then state the why, how, and next steps. Usually, presenters don't do this. Instead they "build up" to the answer. Meanwhile, their audience has "lost the plot". Ever since I adapted this communication style, effectiveness of my communication has been lauded.

The Answer

Pilot C4 Diagramming Standard for the next PI (Planning Increment).

To deliver software that is timely, high-quality, and aligned with business goals, you should adopt the C4 diagramming style as the standard for visualizing architecture. C4 provides a clear, layered way to represent systems that works for executives, architects, and developers alike.


The Why

Executive Perspective

(a) Shared Understanding Across Audiences

C4 diagrams scale from high-level context (business view) to technical detail (developer view), ensuring everyone. From stakeholders to engineers everyone can interpret the architecture without the need for heavy tooling. Just enough design facilitates acceleration of the solution.

(b) Agility with Discipline

Unlike heavyweight modeling approaches, C4 is lightweight and iterative, making it compatible with agile teams while still ensuring design intent is explicit.

(c) Risk Mitigation 

Consistent visual models surface integration, security, and scalability risks early, reducing costly redesigns.

Practitioner Perspective

(a) Clarity of Scope and Boundaries

Context and container diagrams make dependencies, APIs, and infrastructure responsibilities unambiguous.

(b) Scalability and Deployment Readiness

Component and container views map directly to runtime environments, cloud services, and CI/CD pipelines.

(c) Knowledge Retention

C4 diagrams are simple enough to maintain as living documentation, reducing reliance on tribal knowledge.

The How

Like Google Maps, C4 lets you zoom in and out: executives see the “city map” (context), architects see the “neighborhood layout” (containers), and developers see the “street-level details” (components and code).

Leading organizations and open-source communities use C4 to replace ad-hoc diagrams with a consistent, widely understood notation.

Practitioner Example:

  1. Context Diagram: Shows how the system interacts with users and external systems.
  2. Container Diagram: Breaks down major applications, services, and databases.
  3. Component Diagram: Details the internals of each container and key responsibilities.
  4. Code Diagram: Optional, zooming into classes, libraries, or modules for critical areas.

Practically, Context and container diagrams should be developed and maintained. The component and code diagrams usually have diminished return on time investment.

Leading Indicators

Business Outcomes

  • Reduced communication gaps between business and IT.
  • Faster alignment on architectural decisions, accelerating time-to-market.
  • Lower risk of rework by ensuring shared understanding upfront.

Technical Outcomes

  • Consistent, lightweight architecture diagrams across teams.
  • Easier onboarding for new developers and faster knowledge transfer.
  • Clear alignment between architecture, infrastructure, and code.

Decision

  • Decide to adopt C4 as the standard architecture visualization method across projects.
  • Provide teams with starter templates and simple guidance.
  • Pilot the C4 approach in the next project increment and review effectiveness with both stakeholders and developers.

Conclusion

You can steal this, customize it and use it for your company. Good luck!!

Sunday, July 21, 2013

Role of Senior Architects

A key strategy is delegation. This works well if you are comfortable with it.

I espouse a personal philosophy that says if a decision can reasonably be made by someone with a more narrow scope of responsibility, defer the decision to that person or group.

Trust, but verify. Review. Review. Review. Ask open ended questions and have an open channel of communicating early ‘red flags’.

And then hold the group accountable to see through the results of the decision into a tangible deliverable.

Sunday, July 7, 2013

10. ATAM Phase 3 and Conclusion


Purpose: Follow up. This phase is conducted after the conclusion of the ATAM evaluation.

Phase 3 Step 1: Produce the Final Report

Purpose: To write the final report.

Evaluators will write the final report that summarizes the entire ATAM evaluation.

Phase 3 Step 2: Hold the Post Mortem Meeting

Team members fill out

  • Evaluation team post-exercise survey
  • Method improvement survey
  • Evaluation team post-exercise effort survey

Team leader arranges and facilitates meeting and

  • Collects process observer’s report
  • Collects effort data


Phase 3 Step 3: Build Portfolio and Update Artifact Repository

Six months after the evaluation the team leader arranges for the customer to complete the long-term benefit survey.

Conclusion

ATAM is a stakeholder-oriented cross-functional team facilitated architectural review process that results in Risk Themes. Founded on Quality Attributes, Tradeoffs, Sensitivity Points and Risks this process is a proven repeatable method of evaluating software architectures. This process and it’s templates should be customized.

Sunday, June 30, 2013

9. ATAM Phase 2

ATAM Phase 2

Bring the producers and consumers together to ensure that there are no discrepancies.

Write Risk Themes early at least start risk themes documentations early – and try to stick to 5. Not all risks map to a theme, there can be some outliers. The following are two groups of activities in Phase 2:

1. Testing – involves checking the results to date against the needs of all relevant stakeholders

2. Reporting –involves presenting the results of the ATAM

Phase 2 involves bottom-up information gathering and analysis.

- Consumers of the system

o End users

o Application builder

o External entities

- Servicers of the system

o System Admin

o Network Admin

o Maintainers

Review Step 1 -6 with the Phase 2 group. Why? This helps Step 7 because these materials are useful in brainstorming. Do not constrain the group, and changes can be made to the utility tree and other artifacts.

Note: Ask for any documentation (architecture) that was requested in Phase 1. Do accept new documentation created “just for Phase 2”. Just a new view, ensure that existing views are not changed/upgraded or modifying the architecture.

image

Risk Theme

A risk theme is a summarization of multiple similar risks discovered during the analysis of qualified attribute scenarios.

The point out bigger issues in the architecture and are

- Either Commission – i.e. multiple questionable decisions made in the architecture

- Or Omission – i.e. decisions NOT made or requirements not included in the architecture

E.g. Risk Theme: “There is no holistic approach to resource management…” Impacts Business Goals: “Cost, time-to-market, ability to compete with competitors”.

Sunday, June 23, 2013

8. ATAM Scenario Documentation example

Scenario Documentation

The following are templates filled out for scenarios for illustration not completeness.

(H,H) Scenario

Port new to Operating System

Attributes

Portability

Environment

Operating system

Stimulus

New Device

Response

The developers deliver a production quality PAMD Image that supports new device within two months.

Architectural Decisions

Sensitivity

Tradeoff

Risk

Nonrisk

(H,H) Scenario

Port new hardware to existing infrastructure and operating system(s)>\.

Attributes

Portability

Environment

N/A for now

Stimulus

A new device is selected to inclusion into the ecosystem.

Response

PAMD developers deliver a production quality PAMD images is developed for the new device within 2 months (business) or 1 year (IT Arch). [Negotiated to 6 months between Business Owner and IT Architect]

Architectural Decisions

Sensitivity

Tradeoff

Risk

Nonrisk

(H,H) Scenario

Data type incompatibility

Attributes

Reliability

Environment

Run-time

Stimulus

The data type understood by the application changes, without an updated plug-in

Response

The system raises an error, informing the user that the data type is incompatible.

Architectural Decisions

Sensitivity

Tradeoff

Risk

Nonrisk

(H,H) Scenario

Loading PAMD plug-ins and applications

Attributes

Reliability

Environment

Stimulus

User loads 1 additional plug-in or applications that exceeds the system capacity limits.

Response

The system responds by loading the new plug-in or application without crashing.

Architectural Decisions

Sensitivity

Tradeoff

Risk

Nonrisk

Here is the clearest definitions I could come up with:

Risk – a clear risk to the architectural design relative to a single quality attribute.

Nonrisk – a good decision.

Tradeoff – two quality attributes are being balanced here.

Sensitivity Point – a single quality attribute is impacted by

Sunday, June 16, 2013

7. ATAM Utility Tree Example

image

I think a utility tree is a visualization of quality attribute exposures for a given architecture, however it can get pretty cumbersome and the details will loose the big picture. In practice, it really depends on the people reading this and how well familiar they are. Chances are they will not be and the goal will be then for the architect to familiarize the stakeholders or create an alternate artifact.

Sunday, June 9, 2013

5. ATAM Phase 0: Evaluation


Purpose: Partnership & Preparation: Usually present the ATAM to a small group. Get the Business Drivers.

Step 1: Purpose to ensure that the client understands the mechanics of the evaluation method; make sure the client understands the CBA of an architecture evaluation. Record questions for possible FAQ list. Consultants may write up work plans. 75 man days for evaluation team effort– duration best case is 3 weeks.

Step 2: Initial description of the candidate system. Client provides existing documentation describing the system. Client conveys main architectural drivers e.g. business goals, requirements, constraints etc.

Client and evaluation organization agree on necessary architecture documentation – “3 main views”.

NDA – for evaluation team is done at this step.

Evaluators record general business goals, quality attributes, architectural constraints and list of architecture documentation to be delivered to the evaluation team.

Step 3: Go/No-Go decision with respect to conducting ATAM.

Evaluation organization representatives understand the state of the architecture well enough to make a decision and ensure that the candidate system is ready for evaluation.

Evaluation team takes a look at the context drawing and multiple views of the system (e.g. run time etc.)

The list of named participants and their roles with respect to the system must be provided.

Step 4: SOW presentation and negotiation.

Step 5: Form core evaluation team. Aim for 4-6 evaluators.

Modifiability – coupling, encapsulation, contract based interactions, cohesion etc.

Step 6: Conduct evaluation team kick-off meeting.

Team Leader: establishes the time and place for the meeting.

Stickies on a board that can be grouped by risk themes are helpful…or use “Mind Maps”.

Tools like “Enterprise Architect” are used for evaluation in some companies.

Step 7: Prepare and Plan for Phase 1.

Review the purpose of the ATAM phases with the client.

Confirm the time and place for the evaluation for the client to present the system architecture & business goals, architect to present the system architecture and arrange for supplies.

Step 8: Preliminary review of the system’s software architecture.

Hold a brief post-mortem.

Sunday, June 2, 2013

4. ATAM Phases Overview


There are 4 phases of the ATAM evaluation: Phase 0-3.

Phase 0: Partnership & Preparation

· Usually present the ATAM to a small group. Get the Business Drivers.

Phase 1: Initial Evaluation: Step 1-6

· Steps 1-5: We don’t pre-judge here. Just gather information and focus on the pros.

· Step 6: This is still phase 1. Ask questions about the architectural decisions, and do they map back to business drivers?

20110604moonA.jpg

Phase 2: Complete Evaluation: Step 7-9

· Step 7: (Brainstorm & Prioritize) – Phase 2: Show Phase 1 scenarios, you recap.

· Step 8: Analyze Architectural Approaches: You have more stakeholders.

· Step 9: Report out

Phase 3: Follow-up

Sunday, May 26, 2013

3. The Benefits of ATAM Evaluations

 The following are the benefits of Architecture Tradeoff Analysis Methodology (ATAM) -

· Clarified Quality Attribute Requirements

· Improved Architecture documentation

· Documented basis for architectural decisions

· Identify risks early in the life cycle

· Increased communication among stakeholder


· The results are dramatically improved software and solution architectures.

2. ATAM Conceptual Model

The Architecture Tradeoff Analysis Method (ATAM) is a facilitated, stakeholder-driven evaluation process designed to surface risks, non-risks, sensitivity points, and trade-offs in an architecture. Its value lies in creating a structured conversation that aligns technical decisions with business drivers and quality attributes.

Core Concepts

Sensitivity Points

Definition: A property of one or more components that is critical to achieving a specific quality attribute response.

Example: Queue depth is a sensitivity point. Adjusting it directly influences scalability and throughput.

Trade-offs

Definition: A property that simultaneously affects multiple quality attributes, often requiring explicit prioritization.

Example: Persistent vs. non-persistent queues impact durability, availability, and throughput—forcing a conscious trade-off among them.

Conceptual Flow

The ATAM process decouples business drivers and scenarios from the architectural plan and decisions, ensuring a traceable line of reasoning.

A more accurate flow in practice is:

Architectural Plan / Presentation

→ Architectural Approaches (candidate solutions and patterns)

→ Quality Attribute Requirements (QARs) tied to those approaches

→ Architectural Decisions made explicit and evaluated against QARs

Practitioner Advice

Phase Separation: Never run Phase 1 (eliciting drivers and scenarios) and Phase 2 (detailed analysis and trade-offs) in the same week.

Allow 1–2 weeks between phases for participants to reflect, refine scenarios, and prepare.

This gap leads to sharper analysis and more meaningful stakeholder engagement.

Why It Matters for Architects

Brings clarity and rigor to architectural decisions by making implicit trade-offs explicit.

Provides a shared vocabulary for stakeholders and technologists to discuss quality attributes (scalability, availability, performance, etc.).

Ensures that architecture is justified by business drivers, not just technical preference.


See Conceptual Model here: http://www.sei.cmu.edu/architecture/tools/evaluate/atam.cfm

Sunday, May 19, 2013

Understanding Architectures with Pictures


“Pictures speak a 1024 words.” – this is a quote I used a lot for the past 10 years or so. Why? Well this is because architectures need to be visualized. Bredemeyer Consulting’s Visual Architecting Process, SEI’s SAPP, RUP’s UML, Zachman, TOGAF etc. all dwell on visualizing abstractions. But how do you translate that to real projects, and especially those that claim to be agile and misunderstand that to mean no design and no plans? As one of the many signatories of the agile manifesto it is clear to me that those projects that do not know what the architecture is can not deliver software in a timely manner with good quality attributes.

Circuit Board On A Blueprint Background Royalty Free Stock Photos - Image: 7848798

Software Architecture should be represented by a set of views that support its analysis. Usually the following views are most often used:

Advice: At least 3-views recommended by SEI:

1. Module View

2. Component View

3. Deployment View

Plus a sequence diagram can be added as the forth.

Multiple views of a software architecture allow it to be understandable without any confusion by the entire team and its stakeholders.

Sunday, May 12, 2013

Architect with security in mind as a first thought

So if you’re doing a solution architecture review, make sure you first look at the security design of the system including authentication, digital signatures, secret key cryptography, public key cryptography, authorization, and non-repudiation from the perspective of a digital firm. Authentication and authorization are the founding stones of security which needs to be understood and deployed across the enterprise.

The use of digital signatures has seen tremendous growth in recent years and with the onset of new technologies, in particular Web-services, promises to be the dominant area in security. Corporate espionage is on the rise, and security can not be overlooked.
Ensure your system vulnerabilities are checked - Cross Site Scripting seems to be the worst offender in modern systems. Make sure your internet-facing applications are hosted on supported and patched platforms. Approach it with an outside-in, basic-first strategy for your IT department instead of focussing on obtuse things like bit-encryption levels first, ensure you can prioritize defenses against the most probably threat vectors first.

Sunday, May 5, 2013

Embrace Change Don't Just Criticize The Architecture

I love change when it fuels positive growth and innovation. It excites me because I can see ideas that once lived only in my head transform into real products. I enjoy crafting solutions that people can hold, use, and benefit from. That moment, when vision becomes reality, is deeply rewarding to me. The creativity offered by software architecture, user interface design, and backend engineering hits the sweet spot for me.

But in my journey, I’ve often come across software architectures that didn’t start with a vision. They simply “evolved out of need.” Sometimes teams “end up” with architectures that just happened to them, patch by patch, release by release. Other times, projects begin with a neatly sketched design, but even those evolve under the weight of deadlines, tradeoffs, and shifting requirements: Technical Debt.

And that’s not necessarily a failure. Every architecture tells a story of its context.

When speaking to decision makers, I often use analogies. Think about it like buildings. You might look at a structure and think, “Wow, that looks ugly.” But to the contractor, it may be a lucrative project. To the people living inside, the aesthetics may not matter at all. They may say if it ain't broken don't fix it. Architecture, whether in concrete or code, is always a balance between risks, non-risks, tradeoffs, and sensitivity points. I learned that at Carnegie Mellon's Software Engineering Institute. These aren’t just abstract concepts; they are the risk themes that give us the clarity to make informed design decisions.


As a seasoned IT Architect, here's what I believe: no architecture is inherently good or bad. It only becomes meaningful when evaluated through the lens of context and risk. Once risks are surfaced, explained, and understood, the decision shifts from being “good versus bad” to “fit for purpose.”

Monday, April 29, 2013

ATAM

The ATAM process is a short, facilitated interaction between the stakeholders to conduct the activities outlined in the blackboard, leading to the identification of risks, sensitivities, and tradeoffs:

• risks can be the focus of mitigation activities, e.g. further design, further analysis, prototyping

• sensitivities and tradeoffs can be explicitly documented

Architecture reviews are not repeatable without a process. ATAM gives a defined process to achieve a repeatable architecture evaluation process.

The federally funded Software Engineering Institute Carnegie Mellon has pioneered this method for evaluation of software architectures.

Monday, October 22, 2012

Identify a “Big Ball of Mud” in Software

“A Big Ball of Mud is a haphazardly structured, sprawling, sloppy, duct-tape-and-baling-wire, spaghetti-code jungle. These systems show unmistakable signs of unregulated growth, and repeated, expedient repair. Information is shared promiscuously among distant elements of the system, often to the point where nearly all the important information becomes global or duplicated. The overall structure of the system may never have been well defined. If it was, it may have eroded beyond recognition. Programmers with a shred of architectural sensibility shun these quagmires. Only those who are unconcerned about architecture, and, perhaps, are comfortable with the inertia of the day-to-day chore of patching the holes in these failing dikes, are content to work on such systems.”
—Brian Foote and Joseph Yoder, Big Ball of Mud. Fourth Conference on Patterns Languages of Programs (PLoP '97/EuroPLoP '97) Monticello, Illinois, September 1997
  In a development team, people are focused day to day to complete enhancements and/or new tickets. Generally the initial work of setting up the architecture is long over. The understanding of the structures set up and shortcuts thereafter due to exception requirements and a need to deliver ‘yesterday’ usually end up as residue and new dependencies in the code. After a while it is easy to identify codebases that are deemed unfit for consumption.

How do you know if the codebase you’re dealing with is Spaghetti ?
If you’re reviewing new code – well that is simple: as you’re reading the code it makes you proud of the team or person that contributed to it.

There are a lot of other measures: Cyclomatic Complexity, N-Path metrics, dependency mapping, Unused code etc. It is mathematically impossible to determine all unused code via static analysis, however it can provide useful results. A runtime comprehensive usage metrics determination is difficult, depending on the complexity and data needs – it can be nearly impossible to detect unused code. At work, I am working on a strategy that is going to take a million plus lines of code and begin a “cleanup” project. Lining up spaghetti in a big bowl of mud will be challenging. I will post strategies I employ, tactics I use, the tools that prove useful, and the technologies that help in the coming month.


Monday, October 8, 2012

Google’s Big Data Stats

YouTube: 60 hours of video uploaded every 60 seconds.
Google Search Index Size: 100,000,000 GB (and growing)
GMail Active Users: 350,000,000 (and growing)
Search Response Time: 0.25 seconds

These numbers are astonishing. Reliability, Available, Scalable & Performance are Google’s primary quality attributes.
Data – core business asset and few low hanging fruit, growth is faster than the ability to understand it, data capture is slower than the data getting generated, traditional BI tools can’t scale to capture it.
Google has innovated Map Reduce, HDFS, HBase are used by Google to solve for these requirements.

Sunday, September 30, 2012

My response to an expertise request

Solution Key Components:
* Ability to ingest upto 3,000 messages per second from external domain
* Messages can be in XML, EDI, etc format. ~20 kb each.
* Transform into canonical format
* Perform authorization & authentication
* Break message into multiple messages (achieve parallelism)
* Route based on load, content to message queues (JMS, etc)
Function 1:
* Message queue clusters bucket and shoot to Rules engine
* Rules engine devises appropriate action, forwards to event handlers
* Event handler integrates with e-mail service to send an e-mail
Function 2:
* Message hits Data Access layer for storage
* Looking to store Transaction-type data (1bn records per month)
* Need quick retrieval techniques. Ensure Data consistency/quality
* CRUD operation time should be under 0.1 seconds
Web Component:
* Request comes in from an external site for a iFrame request
* Request needs to be authenticated/authorized/load-balanced
* User information should be cached right @ log-in, so cache can retrieve data we expect the user to view, so we don't retrieve when the user starts navigating
* Planning to have an Active/Active multi-site design
* Don't want to do sticky sessions
* Should we have a distributed cache with regions replicated across sites to avoid sticky sessions?
* Web layer needs to handle 500 concurrent requests minimum
* Overall solution primarily designed on-premise (Virtualized environment) with DR-site on public cloud

Solution Architecture
After thinking about the limited problem statement, it seems that security, scalability, data transformation, messaging, declarative rules, HA and persistence are key.  A good architecture style for the solution design would be SEDA See this for reference: http://www.eecs.harvard.edu/~mdw/proj/seda/
The solution should be broken down into a set of stages where a component or a set of components interacts with the data and performs logic. Each stage is connected by queues. An orchestration layer can govern the path depending on the routing logic.
Layer 1: Rules Engine. Fronted with incoming and outgoing queues.
Layer 2: Routing Engine: Choreographs the processes.
Layer 3: Executing Engine: Contains logic and data access.
Layer 4: Presentation: Web Server/App server with logic.
0.1 seconds for data retrieval is enough latency to avoid the complexity of managing a distributed cache. Content caching and Akamai edge cache can be useful instead.
Technologies: Use IBM’s MQ Series to define the queues, clusters etc based on logical names. Install Mule ESB to implement SEDA and routes. Bring in iLog or Aion for the declarative rules engine. Host on internal cloud or EC2.
 

Sunday, May 6, 2012

Trade offs

In the 70s scientists noted that people who had hookworms did not have allergies and asthma. Yuck – who wants hookworms? Well do you want asthma instead ? Nature is all about trade offs. The obvious symbiosis is the result of intricate trade offs at every level. This logic applies in various domains including Software Architecture. An analysis of the architecturally significant trade offs is essential to objectively understanding any complex system relative to risk themes.

Comprehensively analyzing software architectures can be simplified by working along significant attributes. ATAM (Architecture Trade off and Analysis Method) from SEI was developed by Carnegie Mellon University. Between 2006-2009 I visited Carnegie Mellon and took several courses and got myself certified as a Software Architect.  The primary benefit was to gain an appreciation of trade-off analysis based on specific attributes across facets of architecture.

It is another tool in the strategic and objective thinking toolbox that every enterprise architect needs. For more information: http://www.sei.cmu.edu/architecture/tools/evaluate/atam.cfm


Monday, October 10, 2011

Don’t forget data replication strategies

It is still important to decide on your data, server replication strategy when you deploy your core business services and data assets to an internal, external or hybrid cloud models.

Understanding the implications of Active Replication, Passive Replication, Hot Backup, Warm Backup, Cold Backup, State Change Synchronization, Load Balancing and Fault Tolerance are key to making essential choices for a solid deployment architecture on the cloud.

Elasticity, capacity flexibility, horizontal and vertical scalability and dynamic resource allocation makes life a lot easy on the cloud.

Active replication is not achieved by taking cold backups, state changes are not logged for periodic flushes to the replicas, state is not synchronized to only support backup replica when the primary fails. Instead each replica is identical, each replica attempts to process each request – an interceptor takes care of idem potency between replicas. If you want a Primary Service to support all incoming requests, and periodically synchronize its state with the replicas – what you have is a Warm Backup or Passive Replication.

Take a hot backup during times when you have low scalability needs on the RDBMS systems, whereas a cold backup should be reserved for “Sundays” or in the 70s. If you’re going to support the cloud – forger cold backups and start thinking CA (Continuous Availability).

Is WSJF "better" than traditional ROI calculations for Applications?

I love road trips, and i like analogy.   The Premise: Two couples are planning a road trip. The "Perfection" group: This group spe...