Wednesday, September 3, 2025

C4 should be the de-facto diagramming style for SAFe Agile Teams

Intro

Let me first start with how I wrote this, because it's important. In my career I have crafted several architectural decisions. The most challenging presentations are when I have had to address both technical and business audiences. Technical story telling is an essential skill. As the Senior Director of IT Strategy and Architecture, I applied the "Pyramid Principle" extensively. You start with the answer, then state the why, how, and next steps. Usually, presenters don't do this. Instead they "build up" to the answer. Meanwhile, their audience has "lost the plot". Ever since I adapted this communication style, effectiveness of my communication has been lauded.

The Answer

Pilot C4 Diagramming Standard for the next PI (Planning Increment).

To deliver software that is timely, high-quality, and aligned with business goals, you should adopt the C4 diagramming style as the standard for visualizing architecture. C4 provides a clear, layered way to represent systems that works for executives, architects, and developers alike.


The Why

Executive Perspective

(a) Shared Understanding Across Audiences

C4 diagrams scale from high-level context (business view) to technical detail (developer view), ensuring everyone. From stakeholders to engineers everyone can interpret the architecture without the need for heavy tooling. Just enough design facilitates acceleration of the solution.

(b) Agility with Discipline

Unlike heavyweight modeling approaches, C4 is lightweight and iterative, making it compatible with agile teams while still ensuring design intent is explicit.

(c) Risk Mitigation 

Consistent visual models surface integration, security, and scalability risks early, reducing costly redesigns.

Practitioner Perspective

(a) Clarity of Scope and Boundaries

Context and container diagrams make dependencies, APIs, and infrastructure responsibilities unambiguous.

(b) Scalability and Deployment Readiness

Component and container views map directly to runtime environments, cloud services, and CI/CD pipelines.

(c) Knowledge Retention

C4 diagrams are simple enough to maintain as living documentation, reducing reliance on tribal knowledge.

The How

Like Google Maps, C4 lets you zoom in and out: executives see the “city map” (context), architects see the “neighborhood layout” (containers), and developers see the “street-level details” (components and code).

Leading organizations and open-source communities use C4 to replace ad-hoc diagrams with a consistent, widely understood notation.

Practitioner Example:

  1. Context Diagram: Shows how the system interacts with users and external systems.
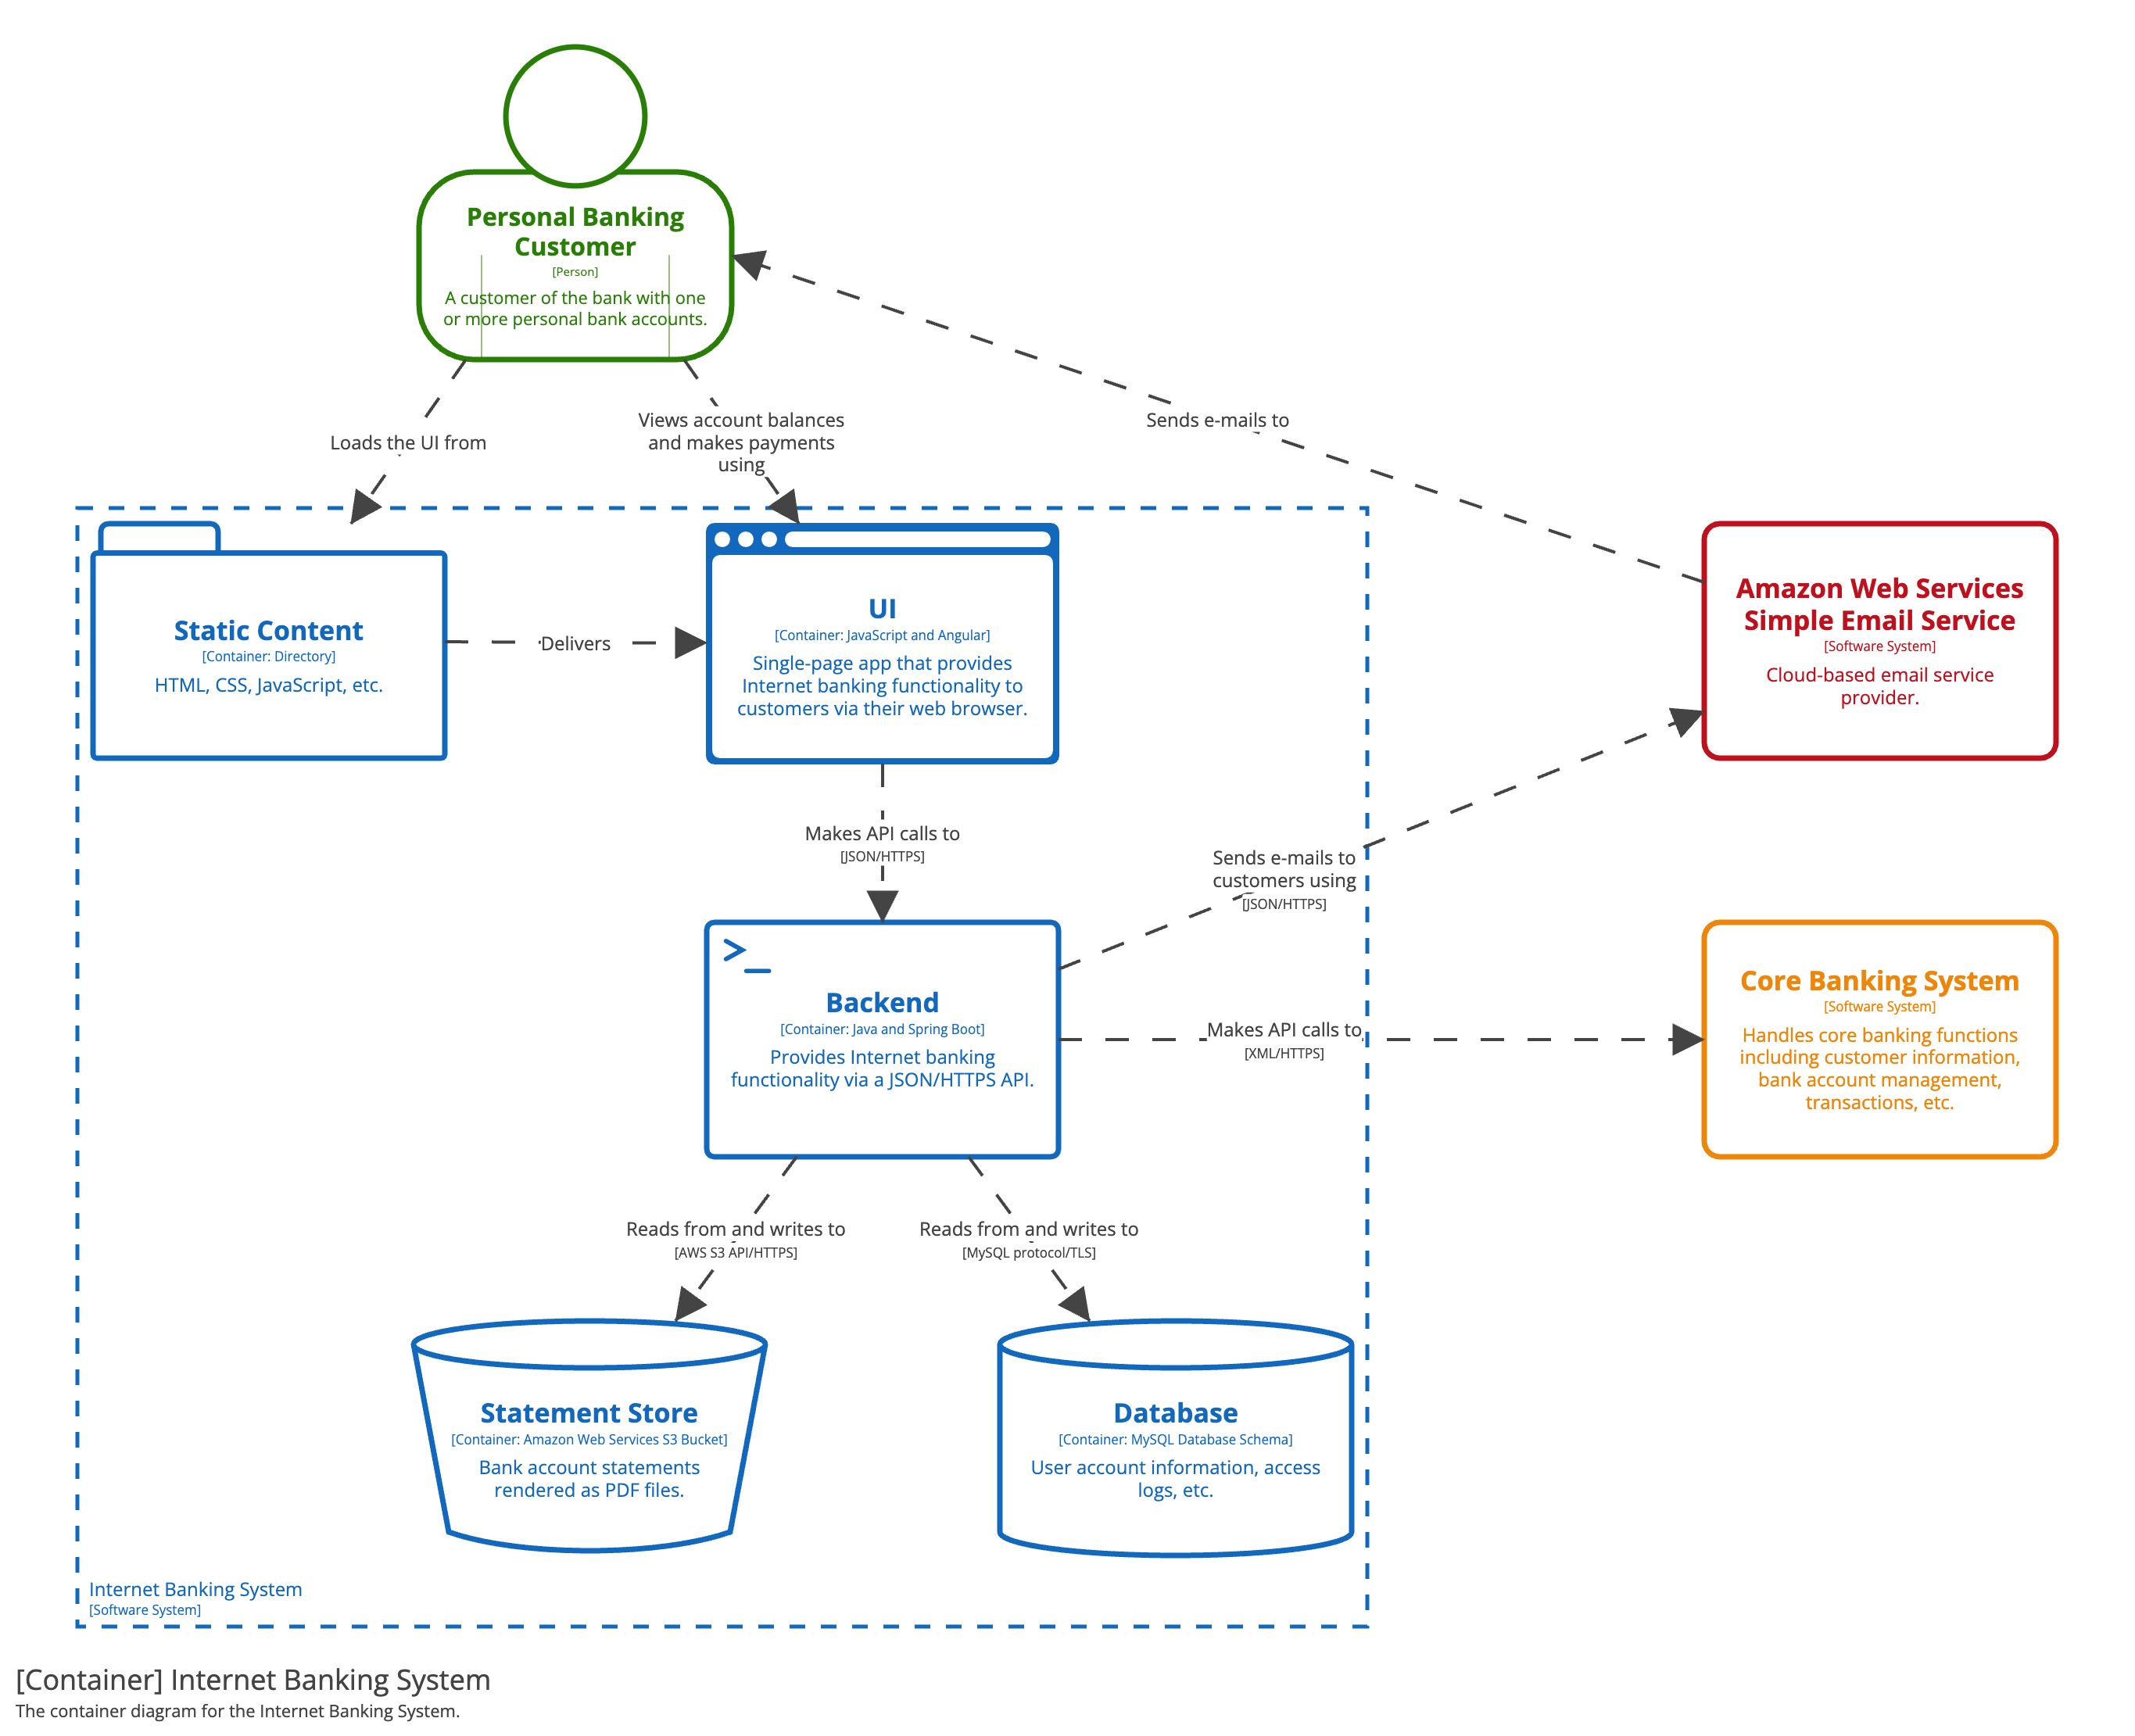
  2. Container Diagram: Breaks down major applications, services, and databases.
  3. Component Diagram: Details the internals of each container and key responsibilities.
  4. Code Diagram: Optional, zooming into classes, libraries, or modules for critical areas.

Practically, Context and container diagrams should be developed and maintained. The component and code diagrams usually have diminished return on time investment.

Leading Indicators

Business Outcomes

  • Reduced communication gaps between business and IT.
  • Faster alignment on architectural decisions, accelerating time-to-market.
  • Lower risk of rework by ensuring shared understanding upfront.

Technical Outcomes

  • Consistent, lightweight architecture diagrams across teams.
  • Easier onboarding for new developers and faster knowledge transfer.
  • Clear alignment between architecture, infrastructure, and code.

Decision

  • Decide to adopt C4 as the standard architecture visualization method across projects.
  • Provide teams with starter templates and simple guidance.
  • Pilot the C4 approach in the next project increment and review effectiveness with both stakeholders and developers.

Conclusion

You can steal this, customize it and use it for your company. Good luck!!

SSL versus TLS

Data communications channels are often insecure, subjecting messages transmitted over the channels to passive and active threats (Barkley, 1994). Internet protocols connect various networks and data packets are transmitted over them. An entire protocol stack exists over which computers exchange messages. For example, Web-browsers sent Hyper-text Markup Language (HTML) messages over the Hyper-text Transfer Protocol (HTTP) which sits on top of the TCP/IP stack. Additional protocols are now in places that create secure channels for such communication, Secure Sockets Layer (SSL) sits between the HTTP and TCP/IP protocols, so for secure Web-page transfers HTTP is transmitted over the standard port 443 of SSL rather than the unsecured port 80 assigned to HTTP. Together this results in HTTPS (HTTP over SSL) communication. Secure socket layer and TLS are security protocols primarily used for network transport of messages.

Secure Sockets Layer

The Secure Sockets Layer (SSL) protocol is a security protocol that provides communication privacy over the Internet by allowing client-server applications to communicate in a way that is designed to prevent eavesdropping, tampering or message forgery (Freier, Karlton & Kocher, 1996). SSL is composed of a handshake protocol and a record protocol, which typically sits on top of a reliable communication protocol like TCP. SSL evolved into its latest version 3.0 resulting in the transport layer security protocol.

Transport Layer Security

The primary goal of The Transport Layer Security (TLS) protocol is to provide privacy and data integrity between two communicating applications; this is used for encapsulation of various higher level protocols (Dierks & Allen, 1999, p. 3). The TLS is actually a combination of two layers, the TLS Record Protocol and the TLS Handshake Protocol. The TLS Record Protocol has two basic properties: connection privacy and reliability. The TLS Handshake protocol has three basic properties: peer identity authentication, shared secret negotiation, and negotiation reliability.

One advantage of TLS is that is independent of the application protocol (Dierks & Allen, 1999, p. 4). Higher-level protocols can be layered on top of this protocol. This leaves the decision of TLS initiation of handshaking and authentication certificate exchanges to the judgment of higher-level protocol designers. The primary goals of the TLS protocol, thus, are to provide cryptographic security, interoperability, and extensibility. These are fundamental requirements of enterprise security.


Thursday, August 28, 2025

The Human-AI Partnership: Why Mastering Touch Typing is Your Next Generative AI Superpower

Generative AI requires humans to establish thought partnership rather than allow AI to take over critical thinking skills. I believe that typing prompts effectively and efficiently is a key skill today. Human-computer interfaces are getting better everyday, there are many modes of computing. For serious AI users, getting rid of the computer keyboard. Learn QWERTY from the 1870s or Dvorak, Colemak. Get used to typing effectively with AI GPTs interactively and effortlessly.

Like many people I too perfected the awkward dance of looking at my keyboard as I typed and then glacing up at the screen. So what's the problem? Well, I realized there are many problems with doing that. I learned to type on my dad's manual typewriter as kid, and making a typing mistake was costly. I typed slowly and deliberately looking at each key as I punched it with all the force to make an impression on the paper behind the ribbon. With that habit set, I transfered it over to coding on a keyboard in just the same and continued with that for most of my life. Until COVID-19 lockdown. 

During the lockdown of 2020-2021 I had a lot of free time. It occurred to me that the way I typed interrupted my flow, created friction between my thoughts and what I typed and did not help my neck and spine ergnomics. I took it upon myself to learn how to type. I humbly decided to get back to the basics of writing with a keyboard. 

According to Quora only 1% of people can type above 90 WPM.

Touch Typing @100 WPM FTW

I made it my mission to improve that, I don't do that anymore I never look at my keyboard, I simply look at the screens and my fingers are trained to find the keys via my kinesthetic sense. This simple yet monumental shift has helped me tremendously in life, career as well as my digital health due to improved ergonomics. Touch typing is not just about speed or a flex for me, it is actually good for my spine and posture, it has helped with note taking and enhanced my productivity significantly.

Left Hand

- Index R T F G V B

- Middle E D C

- Ring WSX

- Little P ;: /?

- Backspace and Delete

Right Hand

- Index Y H N U J M

- Middle I K <,

- Ring O L .>

- Little QAZ


Fig. Typing with all ten fingers


Fig. My typing speed peaked at 101 WPM in 2023. 

I call it good enough for most people, especially a technologist. Typing at the speed of light isn't necessary - just at the speed of thought. Typing fast enough while focussing on the words rather than the mechnics is an important skill. Why not just dictate? I think there are really good dictation tools that can help with speech to text, and it works if you are able to articulate well. In my case, I find editing text skills, and typing are still essential to valuable work. It is also not possible to always have a distraction free, quiet room to be able to dictate and if you care about privacy, it is best to simply stick to typing. Good typing skills are a "forever skill" - is it a no-regrets training because over time, the return on your investment isn't just better typing - it's better flow and improved thinking.  If you force yourself to think slower than you type, the you must learn to type faster. The faster I typed the better my thinking flowed. Optimal speeds of speech are around 200-250 WPM, I can type at around 90 wpm today, so it's still kind of slow. I do think that it's much better than my best non-touch typing at 65wpm that has a lot of interruptions to optimal flow. Touch Typing is a Win-win. 

Typing Club

I signed up for Typing Club and began practicing and training my fingers to find the keys on the keyboard with the correct finger. My typing speed plummeted from 67 (max) down to 20-40WPM range. After a month of this I was ready to give up and really questioned the value of the pain that I was enduring. 
The goal is that each finger should know how to reach the correct key, and it is imperative that technique be mastered slowly. Patience is required. I picked QWERTY for myself just because I was not ready to embark on another layout. I probably won't. I am aiming for good enough. I don't want to type at 200WPM, I am happy with being close to 90+ on a good day.


I would highly recommend completing the basic training offered by https://www.typingclub.com


My Journey of 10 months with 10FastFingers

Which typing site has the most common words for typing practice? 10FastFingers has good statistics and a collection of tests that lets you type away at one minute tests as well as longer tests with the most popular words in the language. 

I spend a few minutes of break on 10FastFingers - its just out of habit. What I have discovered is that my typing speed tells me a lot about my energy levels, focus levels and has a lot to do with the quality of my sleep.

I started practicing typing in 2020 for the first time ever. Until September I literally did not know why there was a bump on the F and J keys on keyboards.

September 11th 2020

This record came in with a eye on the keyboard method. This is the high water mark. This was never achieved again. Most subsequent tests came in at 70 WPM.

Fig. Looking at the keyboard and typing the best I knew how!


September ranging from 55-70, mostly getting to 60-62 wps on average 

The 78 WPM was from my non-touch typing skills. Personal record.

Early morning typing. Mouthed the words. Looked at the words to type, the keyboard and the word that I was typing. Not using my little fingers and not using my forefingers properly.

Starting mid-September 2020 I embarked on a journey to learn touch typing i.e. no look typing

Oct 3rd 2020

My average touch typing speed has reduce by half or more, my error rates are very high. I need to make a lot of corrections on the DAS Keyboard. It is a struggle. 

Sadly its around **35 WPM** with 90% accuracy.

Goal is to increase the touch typing to 100% accuracy with 40 WPM by end of the year with 99% no look touch typing.


Oct 30, 2020 

I am able to hit 50 wpm or higher with ease by Oct 30, 2020.


These results were really making me question the whole endevour. I almost gave up. I slept on it, and then decided to analyze.
I reflected on what I was missing.

Main issues in october that I identified:

- Letter C - instead of using the middle finger i use the index finger

- Letter R and T - i use mostly the middle finger unless there is a sequence. I must always use the index finger.

- I need my left hand to learn better typing.


Nov 4, 2020


I was able to get my Words-per-minute up, but the error rate was close to 10%. As I pushed higher, my error rate increased beyond 11%. 

Fig. 66 WPM Low Accuracy

I went for 400 characters per minute typed, pushed harder - I had a need for speed!

I went for 400 cpm - and hit it ! Of course the number of errors were much higher. But it is possible to hit that number. I can be in the 80s if it try harder. I think hitting 425 correct key strokes may do it. It is all going to be muscle memory. The most efficient memory of all - it is all about procedural memory.
I hit a higher number in competition with greater accuracy.


Pivot to Accuracy First


I decided that it was time to stop pushing speed. Instead, a refocus on perfection was in order. At any cost, I must not be willing to type fast at a rate where the accuracy drops.
Fig. Nov 13, 2020 - 100% accuracy but speed drops to 44 WPM.

Back to the drawing board, I must focus on accuracy and technique and let the speed follow from there on out.

December 2020

Fig. 60 WPM at 100% accuracy.
I was able to hit 60 wpm with 100% accuracy.

Fig. 95% accuracy

Fig. 94% accuracy

I hit the 80s in 2021
Fig. Low Accuracy but touched the 80 wpm mark

I wanted to improve my accuracy and at the same time my speed improved as well. I was a happy camper.


Fig. 85 WPM 2-12-2021

Fig 86 WPM higher accuracy
Fig. 86 with high character count
Fig 86 at 98% accuracy

Fig. Almost perfect accuracy at 88 WPM!! 

Each typing result at this level gave me tremendous motivation and purpose to forge ahead. The lockdown was creating all kinds of time for me, and I knew that I was close to my goal of hitting the high 90s or even a 100. So close!


Fig. Accuracy 98%
Fig. Accuracy 98%


Jun 2, 2021 I was hitting 95 WPM at accuracy greater than 95%.

I had purchased the IQUNIX F96 Mechnical Keyboard

Brown switches, and also the DAS Professional Keyboard with the clicky blue switches.
Neither keyboard had any markings on the keys. This was purely a flex. Only "real" geeks could use my computer.
I watched a lot of videos for motivation, tips and tricks to keep improving.


I used a few other sites as well for fine tuning, variety and fun.

KeyBR

A site that is driven by Artificial Intelligence that detects issues in common key combinations and provides practice specific to an individual weakness. KeyBR helped me by learning what key combinations were my weakest and helped practice those specific areas. It's simply a great free resource for fine-tuning.


MonkeyType: A clean, minimalistic site that really helped me track down my rate during the minute of typing, and it is also extensible in many ways. I would use this a lot.

Type Rush: This site provides a boat race as well as car race with full gamification like prize winnings. It was fun to compete and added an element of pressure to perform against others. As I typed the car went forward. I won many races, and it does get progresively more challenging.

Key Hero: I most enjoyed the quotes, and paragraphs provided by this site. If you do NOT fix the errors, a penalty is added to the infal WPM score. I am not a fan of how the scoring is done. I consistently scored low on these test, and paradoxically enjoyed them.

Conclusion

It was well worth it. This one skill is a forever skill and has continued to pay me dividends. I enjoy thinking, and writing. It enables me to use my mind creatively, and think better. I use my skills today to prompt AI to help partner with me and my touch typing skills are an essential tool, skill and method that help me get the most in and out of my brain.

References

  1. https://10fastfingers.com/typing-test/english
  2. https://www.keyhero.com/free-typing-test/
  3. https://zty.pe/
  4. https://www.ratatype.com/typing-test/
  5. https://www.how-to-type.com/touch-typing-lessons/how-to-type-home-keys/
  6. https://medium.com/@mantasd/touch-typing-how-long-does-it-take-to-reach-100-wpm-129ba855d038
  7. https://www.keyhero.com/free-typing-test


Sunday, September 8, 2013

Not Only SQL

NO SQL is basically a highly scalable disruptive data storage technology. The basic downsides included proprietary APIs (no standard SQL), evolving capabilities, loads of vendors, lack of skills.

Here’s some information from the net…

FoundationDB – has the added advantage of providing data consistency.
 
MapR - SQL capabilities over large-scale distributed systems including Hadoop and NoSQL databases
 
GridGain - brings in-memory capabilities to MongoDB. Achieves elastic scale and automatic transparent re-sharding
 
Scientel - Gensonix® stores structured/unstructured data in Relational, Hierarchical, Network, and Column formats, and scales to trillions of real-time transactions.
 
Accumulo - enable online model building and dynamic indexing to support both retrospective analysis and enrichment of streaming data.
 
Microsoft - Windows Azure Tables offer the best of both scalability and ACID guarantees.
 
RavenDB - a schema-less document database that offers fully ACID transactions, fast and flexible search, replication, sharding, and a simple RESTful API
 
eXist-db - High-performance native XML database engine and all-in-one solution for application building.
 
Cloudant - providing strong-consistency for single-document operations.
 
Aerospike - optimized for SSDs through a highly parallelized, distributed architecture.
 
StarCounter - an in-memory database that processes millions of database transactions per second on a single machine.

Sunday, July 21, 2013

Role of Senior Architects

A key strategy is delegation. This works well if you are comfortable with it.

I espouse a personal philosophy that says if a decision can reasonably be made by someone with a more narrow scope of responsibility, defer the decision to that person or group.

Trust, but verify. Review. Review. Review. Ask open ended questions and have an open channel of communicating early ‘red flags’.

And then hold the group accountable to see through the results of the decision into a tangible deliverable.

Sunday, July 7, 2013

10. ATAM Phase 3 and Conclusion


Purpose: Follow up. This phase is conducted after the conclusion of the ATAM evaluation.

Phase 3 Step 1: Produce the Final Report

Purpose: To write the final report.

Evaluators will write the final report that summarizes the entire ATAM evaluation.

Phase 3 Step 2: Hold the Post Mortem Meeting

Team members fill out

  • Evaluation team post-exercise survey
  • Method improvement survey
  • Evaluation team post-exercise effort survey

Team leader arranges and facilitates meeting and

  • Collects process observer’s report
  • Collects effort data


Phase 3 Step 3: Build Portfolio and Update Artifact Repository

Six months after the evaluation the team leader arranges for the customer to complete the long-term benefit survey.

Conclusion

ATAM is a stakeholder-oriented cross-functional team facilitated architectural review process that results in Risk Themes. Founded on Quality Attributes, Tradeoffs, Sensitivity Points and Risks this process is a proven repeatable method of evaluating software architectures. This process and it’s templates should be customized.

Sunday, June 30, 2013

9. ATAM Phase 2

ATAM Phase 2

Bring the producers and consumers together to ensure that there are no discrepancies.

Write Risk Themes early at least start risk themes documentations early – and try to stick to 5. Not all risks map to a theme, there can be some outliers. The following are two groups of activities in Phase 2:

1. Testing – involves checking the results to date against the needs of all relevant stakeholders

2. Reporting –involves presenting the results of the ATAM

Phase 2 involves bottom-up information gathering and analysis.

- Consumers of the system

o End users

o Application builder

o External entities

- Servicers of the system

o System Admin

o Network Admin

o Maintainers

Review Step 1 -6 with the Phase 2 group. Why? This helps Step 7 because these materials are useful in brainstorming. Do not constrain the group, and changes can be made to the utility tree and other artifacts.

Note: Ask for any documentation (architecture) that was requested in Phase 1. Do accept new documentation created “just for Phase 2”. Just a new view, ensure that existing views are not changed/upgraded or modifying the architecture.

image

Risk Theme

A risk theme is a summarization of multiple similar risks discovered during the analysis of qualified attribute scenarios.

The point out bigger issues in the architecture and are

- Either Commission – i.e. multiple questionable decisions made in the architecture

- Or Omission – i.e. decisions NOT made or requirements not included in the architecture

E.g. Risk Theme: “There is no holistic approach to resource management…” Impacts Business Goals: “Cost, time-to-market, ability to compete with competitors”.

Sunday, June 23, 2013

8. ATAM Scenario Documentation example

Scenario Documentation

The following are templates filled out for scenarios for illustration not completeness.

(H,H) Scenario

Port new to Operating System

Attributes

Portability

Environment

Operating system

Stimulus

New Device

Response

The developers deliver a production quality PAMD Image that supports new device within two months.

Architectural Decisions

Sensitivity

Tradeoff

Risk

Nonrisk

(H,H) Scenario

Port new hardware to existing infrastructure and operating system(s)>\.

Attributes

Portability

Environment

N/A for now

Stimulus

A new device is selected to inclusion into the ecosystem.

Response

PAMD developers deliver a production quality PAMD images is developed for the new device within 2 months (business) or 1 year (IT Arch). [Negotiated to 6 months between Business Owner and IT Architect]

Architectural Decisions

Sensitivity

Tradeoff

Risk

Nonrisk

(H,H) Scenario

Data type incompatibility

Attributes

Reliability

Environment

Run-time

Stimulus

The data type understood by the application changes, without an updated plug-in

Response

The system raises an error, informing the user that the data type is incompatible.

Architectural Decisions

Sensitivity

Tradeoff

Risk

Nonrisk

(H,H) Scenario

Loading PAMD plug-ins and applications

Attributes

Reliability

Environment

Stimulus

User loads 1 additional plug-in or applications that exceeds the system capacity limits.

Response

The system responds by loading the new plug-in or application without crashing.

Architectural Decisions

Sensitivity

Tradeoff

Risk

Nonrisk

Here is the clearest definitions I could come up with:

Risk – a clear risk to the architectural design relative to a single quality attribute.

Nonrisk – a good decision.

Tradeoff – two quality attributes are being balanced here.

Sensitivity Point – a single quality attribute is impacted by

Sunday, June 16, 2013

7. ATAM Utility Tree Example

image

I think a utility tree is a visualization of quality attribute exposures for a given architecture, however it can get pretty cumbersome and the details will loose the big picture. In practice, it really depends on the people reading this and how well familiar they are. Chances are they will not be and the goal will be then for the architect to familiarize the stakeholders or create an alternate artifact.

Sunday, June 9, 2013

5. ATAM Phase 0: Evaluation


Purpose: Partnership & Preparation: Usually present the ATAM to a small group. Get the Business Drivers.

Step 1: Purpose to ensure that the client understands the mechanics of the evaluation method; make sure the client understands the CBA of an architecture evaluation. Record questions for possible FAQ list. Consultants may write up work plans. 75 man days for evaluation team effort– duration best case is 3 weeks.

Step 2: Initial description of the candidate system. Client provides existing documentation describing the system. Client conveys main architectural drivers e.g. business goals, requirements, constraints etc.

Client and evaluation organization agree on necessary architecture documentation – “3 main views”.

NDA – for evaluation team is done at this step.

Evaluators record general business goals, quality attributes, architectural constraints and list of architecture documentation to be delivered to the evaluation team.

Step 3: Go/No-Go decision with respect to conducting ATAM.

Evaluation organization representatives understand the state of the architecture well enough to make a decision and ensure that the candidate system is ready for evaluation.

Evaluation team takes a look at the context drawing and multiple views of the system (e.g. run time etc.)

The list of named participants and their roles with respect to the system must be provided.

Step 4: SOW presentation and negotiation.

Step 5: Form core evaluation team. Aim for 4-6 evaluators.

Modifiability – coupling, encapsulation, contract based interactions, cohesion etc.

Step 6: Conduct evaluation team kick-off meeting.

Team Leader: establishes the time and place for the meeting.

Stickies on a board that can be grouped by risk themes are helpful…or use “Mind Maps”.

Tools like “Enterprise Architect” are used for evaluation in some companies.

Step 7: Prepare and Plan for Phase 1.

Review the purpose of the ATAM phases with the client.

Confirm the time and place for the evaluation for the client to present the system architecture & business goals, architect to present the system architecture and arrange for supplies.

Step 8: Preliminary review of the system’s software architecture.

Hold a brief post-mortem.

Sunday, June 2, 2013

4. ATAM Phases Overview


There are 4 phases of the ATAM evaluation: Phase 0-3.

Phase 0: Partnership & Preparation

· Usually present the ATAM to a small group. Get the Business Drivers.

Phase 1: Initial Evaluation: Step 1-6

· Steps 1-5: We don’t pre-judge here. Just gather information and focus on the pros.

· Step 6: This is still phase 1. Ask questions about the architectural decisions, and do they map back to business drivers?

20110604moonA.jpg

Phase 2: Complete Evaluation: Step 7-9

· Step 7: (Brainstorm & Prioritize) – Phase 2: Show Phase 1 scenarios, you recap.

· Step 8: Analyze Architectural Approaches: You have more stakeholders.

· Step 9: Report out

Phase 3: Follow-up

Is WSJF "better" than traditional ROI calculations for Applications?

I love road trips, and i like analogy.   The Premise: Two couples are planning a road trip. The "Perfection" group: This group spe...