
Intro
The Answer
Pilot C4 Diagramming Standard for the next PI (Planning Increment).
To deliver software that is timely, high-quality, and aligned with business goals, you should adopt the C4 diagramming style as the standard for visualizing architecture. C4 provides a clear, layered way to represent systems that works for executives, architects, and developers alike.
The Why
Executive Perspective
(a) Shared Understanding Across Audiences
C4 diagrams scale from high-level context (business view) to technical detail (developer view), ensuring everyone. From stakeholders to engineers everyone can interpret the architecture without the need for heavy tooling. Just enough design facilitates acceleration of the solution.
(b) Agility with Discipline
Unlike heavyweight modeling approaches, C4 is lightweight and iterative, making it compatible with agile teams while still ensuring design intent is explicit.
(c) Risk Mitigation
Consistent visual models surface integration, security, and scalability risks early, reducing costly redesigns.
Practitioner Perspective
(a) Clarity of Scope and Boundaries
Context and container diagrams make dependencies, APIs, and infrastructure responsibilities unambiguous.
(b) Scalability and Deployment Readiness
Component and container views map directly to runtime environments, cloud services, and CI/CD pipelines.
(c) Knowledge Retention
C4 diagrams are simple enough to maintain as living documentation, reducing reliance on tribal knowledge.
The How
Like Google Maps, C4 lets you zoom in and out: executives see the “city map” (context), architects see the “neighborhood layout” (containers), and developers see the “street-level details” (components and code).
Leading organizations and open-source communities use C4 to replace ad-hoc diagrams with a consistent, widely understood notation.
Practitioner Example:
- Context Diagram: Shows how the system interacts with users and external systems.
- Container Diagram: Breaks down major applications, services, and databases.
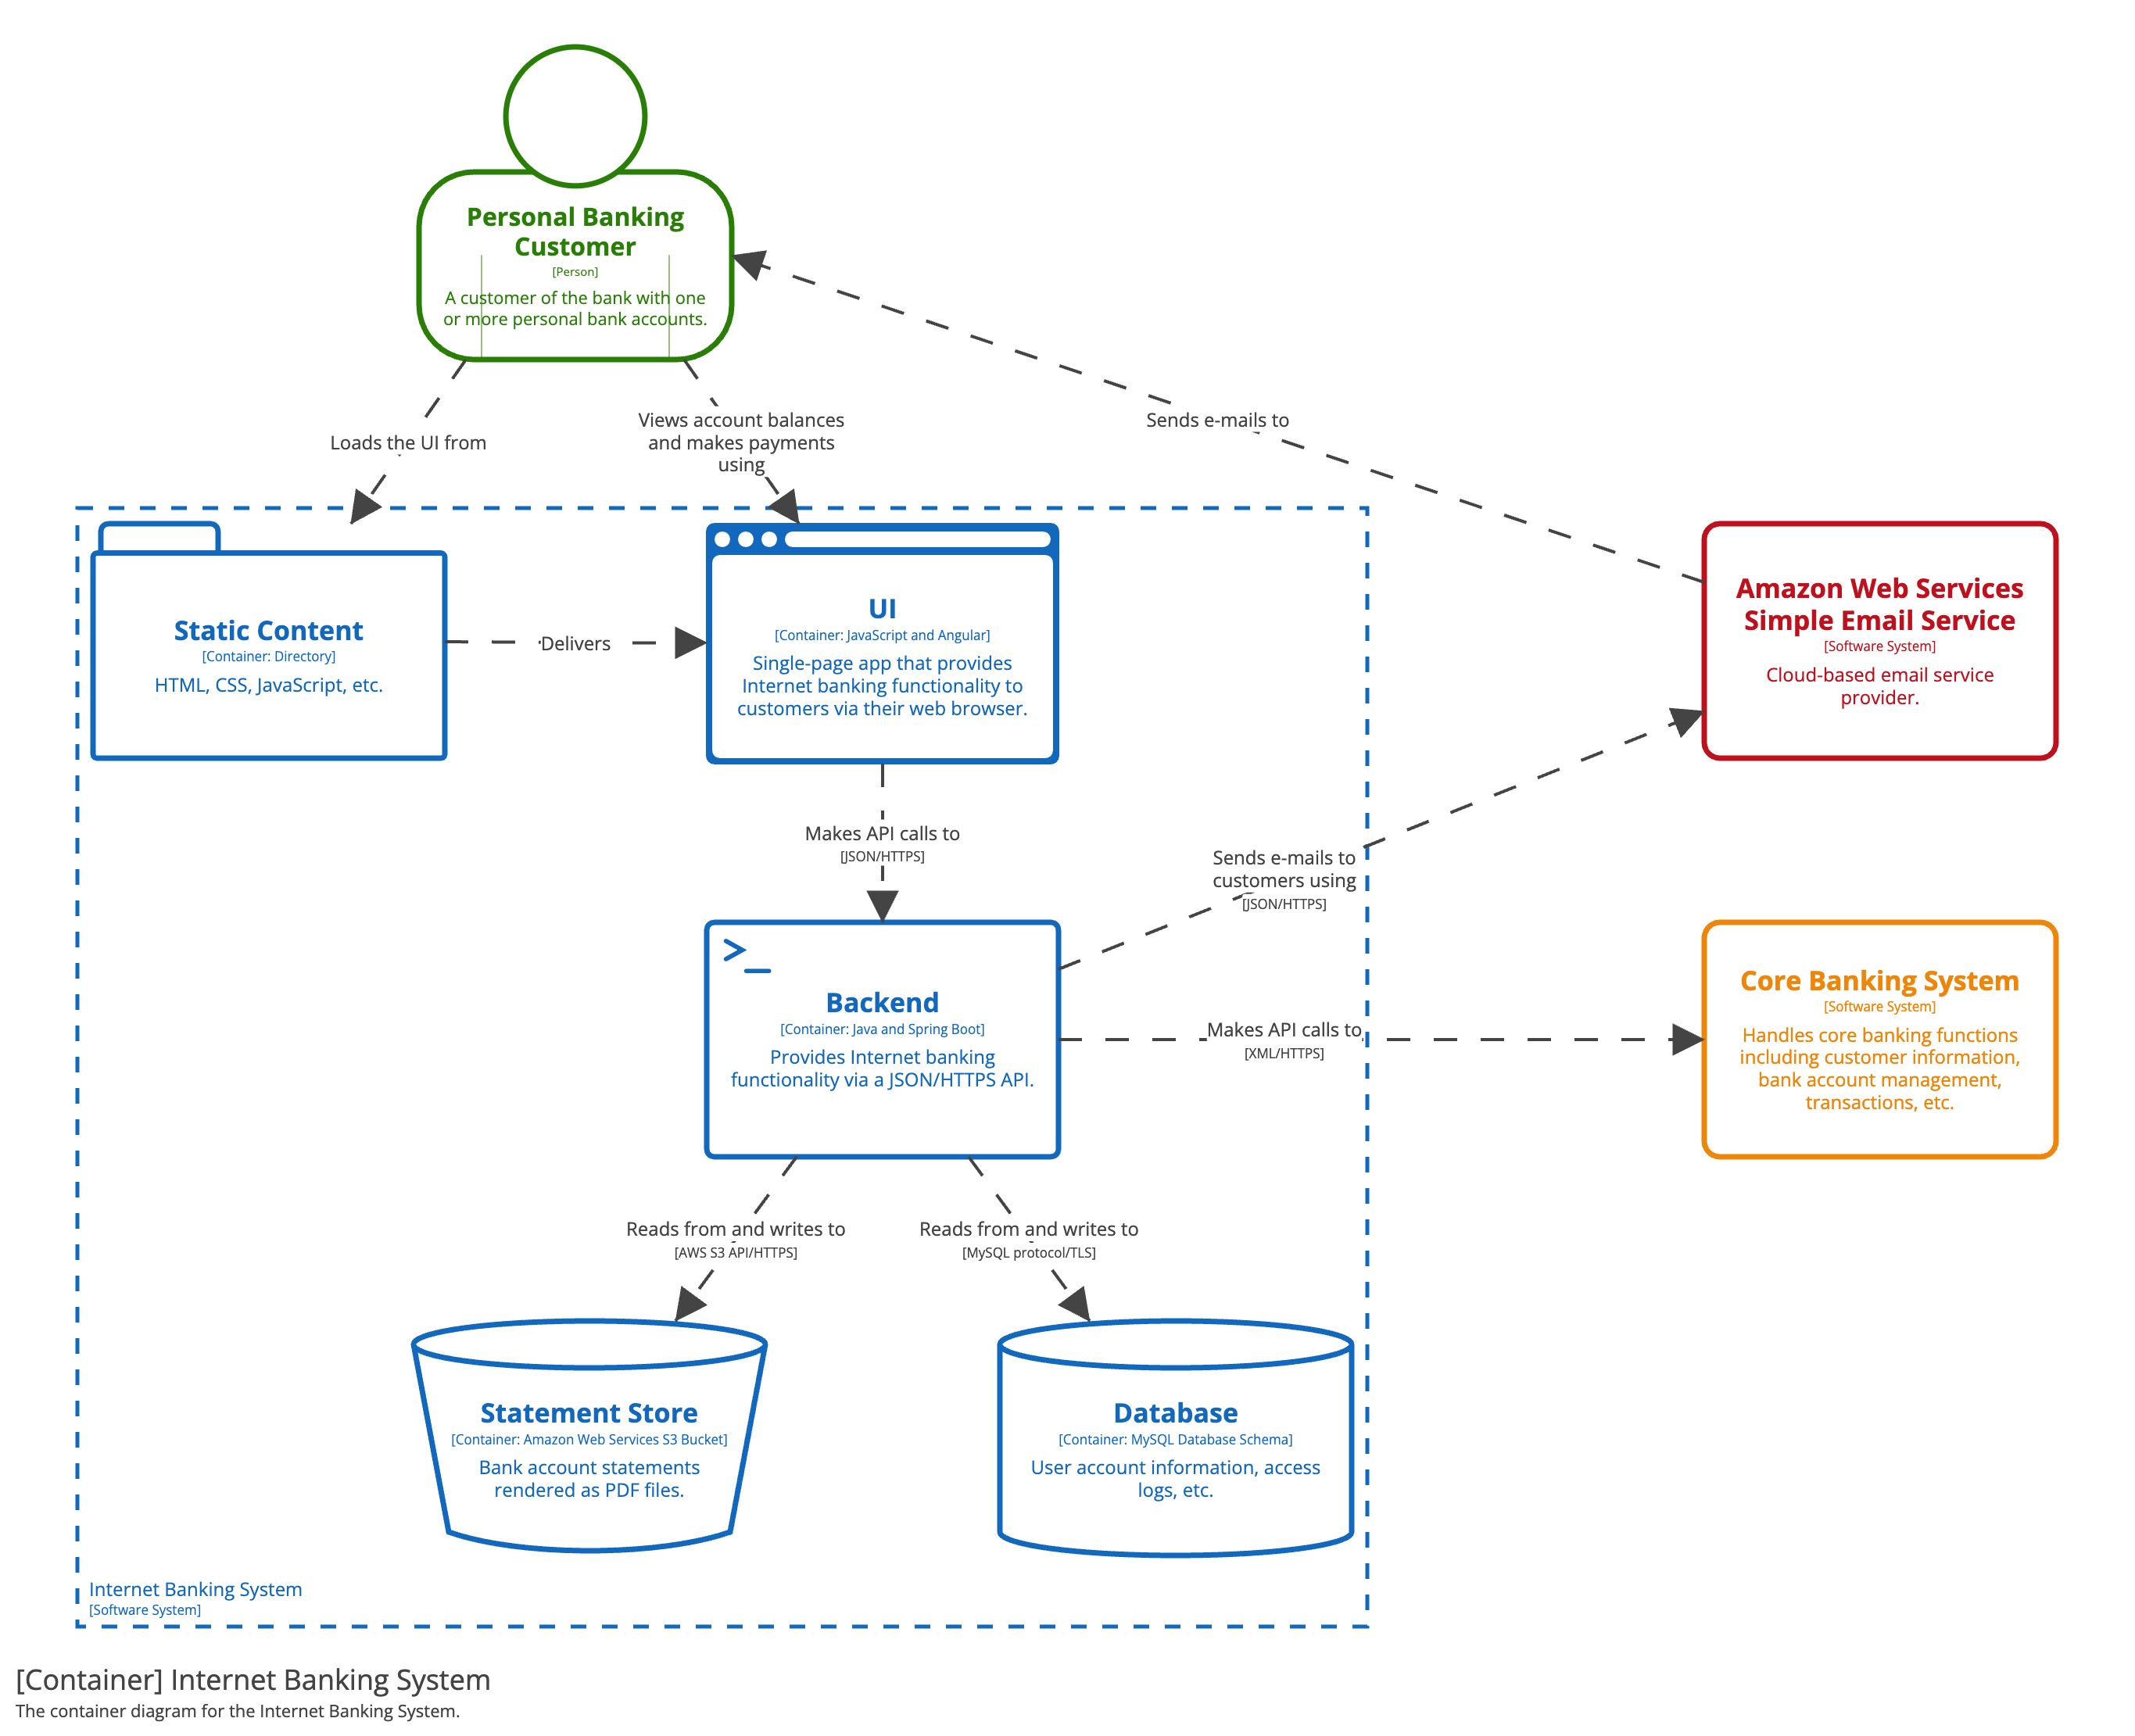
- Component Diagram: Details the internals of each container and key responsibilities.
- Code Diagram: Optional, zooming into classes, libraries, or modules for critical areas.
Leading Indicators
Business Outcomes
- Reduced communication gaps between business and IT.
- Faster alignment on architectural decisions, accelerating time-to-market.
- Lower risk of rework by ensuring shared understanding upfront.
Technical Outcomes
- Consistent, lightweight architecture diagrams across teams.
- Easier onboarding for new developers and faster knowledge transfer.
- Clear alignment between architecture, infrastructure, and code.
Decision
- Decide to adopt C4 as the standard architecture visualization method across projects.
- Provide teams with starter templates and simple guidance.
- Pilot the C4 approach in the next project increment and review effectiveness with both stakeholders and developers.


